- Data Professor
- Posts
- Build Your First Shiny Web App in R

Do you want to make your R code publicly available for others to use? If you answered yes, then this article is for you as I will be showing you how to build your very first web application in R using the Shiny package.
To supplement this article, you can also watch this tutorial video Building Your First Web Application in R that I made on my YouTube channel called the Data Professor.
Data Science Life Cycle
The data science life cycle starts with the collection of data that will serve as the dataset and the core component of a data science project. Next, this dataset needs to be cleaned to void itself of missing data as well as any abnormalities. As the name implies, exploratory data analysis (EDA) will allow us to take a glimpse of the general characteristics of the dataset and this can be attained by performing descriptive statistics and data visualizations. Insights gained from EDA may provide starting points and ideas for building predictive models (e.g. classification, regression, clustering, association analysis, etc.). To complete the life cycle the best performing model can be deployed as an application programming interface (API) and web application.

Data Science Life Cycle. (Drawn by Chanin Nantasenamat)
Why Build a Web App?
So the question is, why would you want to build a web application? That’s a great question!
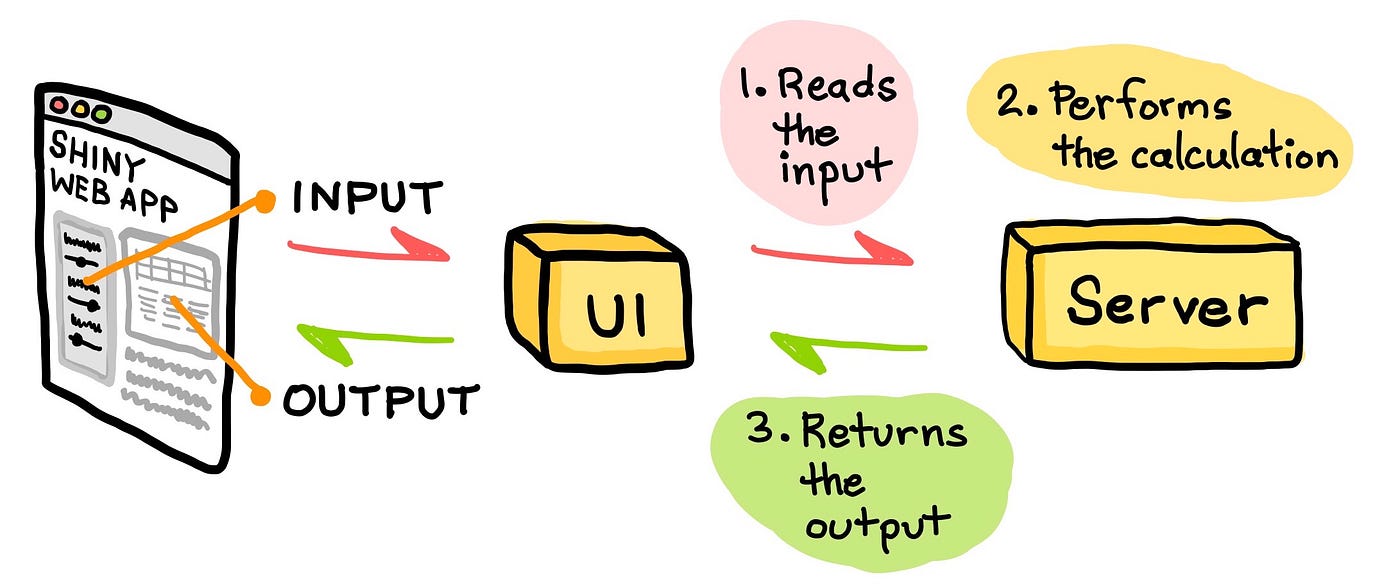
The deployed web application provides a graphical front-end (user interface or UI) that allow users to enter input parameters that the back-end (the server) will process and send back for display on the web front-end. In the context of machine learning, the deployment of a trained machine learning model as a web application allow users to easily make predictions by simply entering the input parameters into the form provided on the web front-end that will serve as input features to the trained machine learning model where the model will make a prediction.
All this at the convenience of a few clicks of the mouse as the user will not need to have any technical knowledge in coding for making such prediction. In this article, you’ll be learning how to make a web application in R using the Shiny package.
Aside from deploying machine learning models, web applications can be created to host data-driven dashboard as well. These dashboards may provide useful summary data of interest that can essentially be used for real-time monitoring and assessment of metrics and performance.
What is Shiny?
Before we proceed further, perhaps a brief background about what exactly is Shiny.
Shiny is an R package that allows you to easily build interactive web applications. The benefit of using Shiny is that it makes it possible to extend your R code to the web that would essentially help to expand its usability to a wider community (i.e. from being used by a single user to being used by hundreds or thousands of users via the internet).
Aside from the functionalities provided by the Shiny package, there are several extension packages that supplements the functionality of Shiny such as shinythemes, shinydashboard, shinyjs, etc.
What Can You Build with Shiny?
That’s a great question! The following are some starter ideas and I’m sure you can think of several more.
Machine learning powered web application
Data-driven dashboards
Data collection forms
There are tons of additional examples at the Shiny Gallery.
Deploying the Web Application to the Internet
After testing the Shiny web apps on your own local computer and you are confident that it works and are ready to publish to the internet you can deploy it onto your own server (e.g. Digital Ocean) or via app hosting services such as Shinyapps.io and Heroku. So what’s the difference between the two?
The benefit of having your own server is that you have total control on the computer and as a result you can install all softwares, modules and packages to your heart’s content. The downside of this is that you would need to have a great deal of knowledge to manage the server. For example, you may need to be proficient in BASH commands in order to manage a Ubuntu server on the cloud via service providers such as Digital Ocean ($100 Free Credit), Linode, Amazon Web Service or Google Cloud Platform.
The benefit of using an app hosting service is that you don’t have to worry about managing a server. That’s right, no more dealing with server updates, no more configuration of paths and complex compilation of softwares and libraries. These app hosting service providers allows you to focus your energy on building the application, period!
Structure of a Shiny Web App
The Shiny web app is comprised of 3 components:
User interface (ui.R) — The UI is the frontend that accepts user input values.
Server function (server.R) — The Server is the backend that process these input values to finally produce the output results that are finally displayed on the website.
shinyApp function — The app itself that combines the UI and server components together.
Schematic illustration of how a Shiny web app works. (Drawn by Chanin Nantasenamat)
Code of the Shiny Web App
Now, comes the fun part and let’s have a look at the code of the Shiny web app that we are going to be building today (shown below).
# Load R packages
library(shiny)
library(shinythemes)

  # Define UI
  ui <- fluidPage(theme = shinytheme("cerulean"),
    navbarPage(

      "My first app",
      tabPanel("Navbar 1",
               sidebarPanel(
                 tags$h3("Input:"),
                 textInput("txt1", "Given Name:", ""),
                 textInput("txt2", "Surname:", "")

               ), # sidebarPanel
               mainPanel(
                            h1("Header 1"),

                            h4("Output 1"),
                            verbatimTextOutput("txtout")
               ) # mainPanel

      ), # Navbar 1, tabPanel
      tabPanel("Navbar 2", "This panel is intentionally left blank"),
      tabPanel("Navbar 3", "This panel is intentionally left blank")

    ) # navbarPage
  ) # fluidPage

  # Define server function
  server <- function(input, output) {

    output$txtout <- renderText({
      paste( input$txt1, input$txt2, sep = " " )
    })
  }

  # Create Shiny object
  shinyApp(ui = ui, server = server)
How Does the Shiny Web App Works?
A cartoon illustration of what is going on under the hood as we use the Shiny web app is summarized below in 3 simple steps.
Running the Shiny Web App
Now, let’s run the web application.
Step 1. Go ahead and fire up your RStudio.
Step 2. Click on File → New File → R Script and paste the entire block of code shown above and save it as app.R (or you can download the app.R file).
Step 3. Click on the Run App button (shown below by the white circle below) that is located at the top right of the File Panel.

Screenshot of the app.R file containing the Shiny Web App inside RStudio.
After a few moments, you will see a pop-up window displaying the Shiny web app as shown below. Notice that the web app has empty output value because the input parameters are still empty.
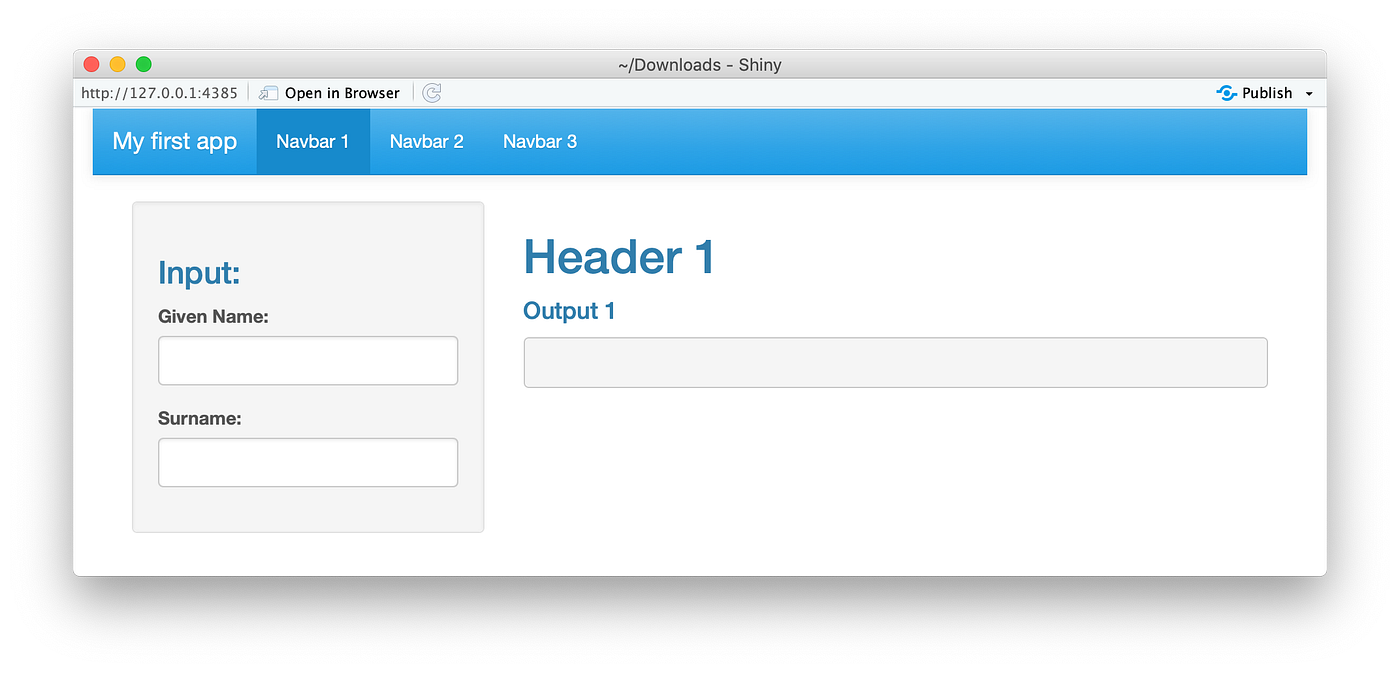
Screenshot of the executed app.R file (after hitting on the Run App button).
Let’s fill in the values into the two input box (Given Name and Surname) and you will see that the Output box (the Main Panel) will now display the concatenated Given Name + Surname. For example, we use “Machine” as the Given Name and “Learning” as the Surname. Under the hood, the UI component accepts the input arguments from the 2 text box for Given Name and Surname. Next, we concatenate the two variables to produce an output of “Machine Learning”. Finally, the UI displays this output on the Main Panel (the gray box).
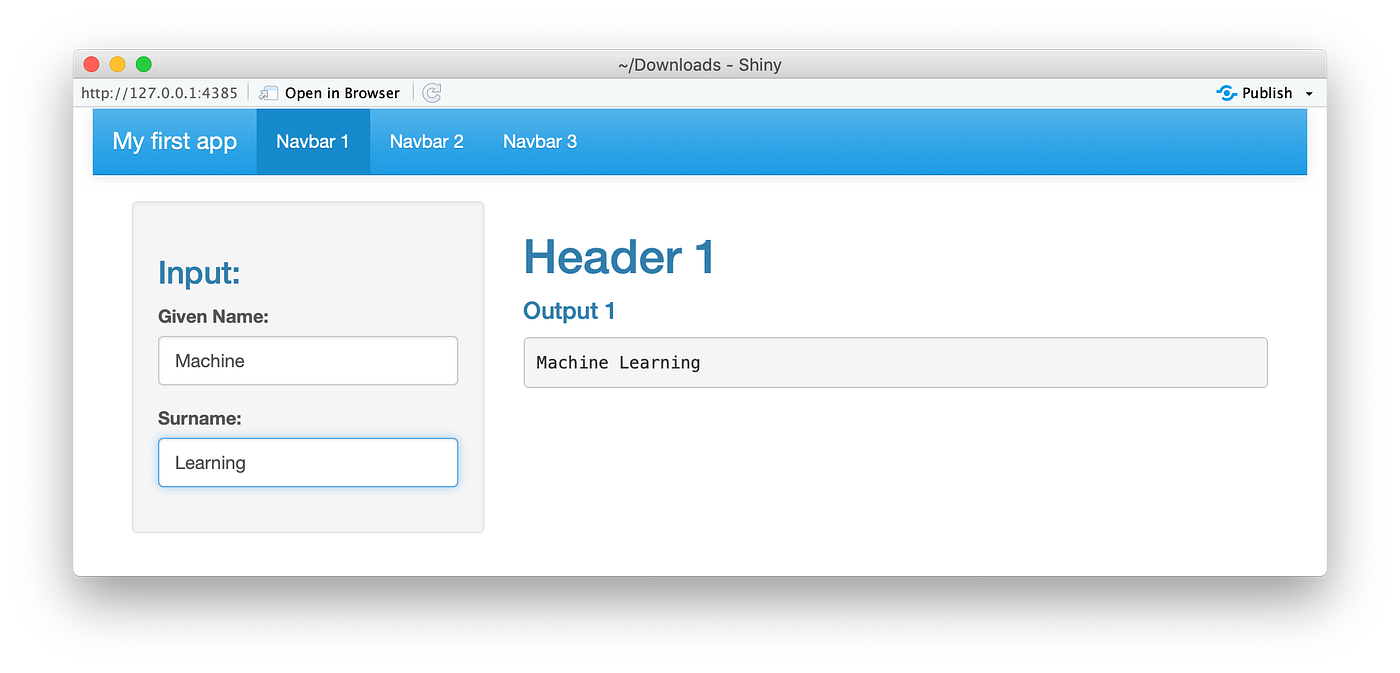
Screenshot of the web app with input parameters entered.
Line-by-Line Explanation of the Code
The code shown above has been commented to label the major sections of the code as follows:
# Load R packages(Line 1),# Define UI(Line 5),# Define server function(Line 31)# Create Shiny object(Line 39)
Now, we will be covering the above 4 sections in more depth in the forthcoming sub-sections.
Load R packages (Lines 1–3)
Line 2 — Load the
shinypackageLine 3 — Load the
shinythemespackage
Define UI (Lines 5–29)
Line 6 — The
fluidPage()function creates fluid page layouts whereby the elements can scale to occupy the available width of the browser. All UI elements are contained within thefluidPage()function. The first input argument that we use is thethemeoption where we define the use of theceruleantheme from theshinythemeR package.
(Note: The closing parenthesis is on Line 29).Line 7 — As the name implies, the
navbarPage()function creates a page with a top level navigation bar.
Line 9 — The name of the web app is defined to be“My first app”.
Line 10 — Here we define the tab panel using thetabPanel()function. This represents the first of three tab panels and thus we define the tab panel to be“Navbar 1”.Line 11 — Here we make use of the
sidebarPanel()function (closing parenthesis is on Line 16) so that the web app can have a sidebar panel on the left of the web app that accepts user input parameters. Line 12 — The HTML tagtags$h3is used to provide the sidebar panel the subsubheading title of“Input:”.
Lines 13-14— ThetextInput()function is used to accept input values from users in the form of a text field. The input arguments contained within the textInput() function includes the (1) variable name (e.g.txt1ortxt2), (2) heading that is displayed above the text field (e.g.“Given Name:”and“Surname:”) and (3)
(Note: The closing parenthesis is on Line 28).Line 17 — Here we make use of the
mainPanel()function (closing parenthesis is on Line 22).
Line 18 — Displays the heading of“Header 1”by using theh1()tag function.
Line 20 — Displays the subsubsubheading (not a typo but to signify the hierarchy of the headings) of“Output1”by using theh4()tag function.
Line 21 — Displays the output value which is obtained by combining the input values (Given Name and Surname) together.Lines 25–26 — The two remaining tab panels are displayed via the
tabPanel()function on these 2 lines. The first input argument is the name of the tab panel which is“Navbar 2”or“Navbar 3”while the second input argument is“This panel is intentionally left blank”. As a result, upon clicking on these 2 tab panels we will see the message“This panel is intentionally left blank”which are the content of these 2 tab panels.
Define server function (Lines 31–37)
Line 32 — Defines the server whereby the input and output variables are essentially connected via reactivity (i.e. changes in the input value will instantaneously or reactively lead to updating of the output value).
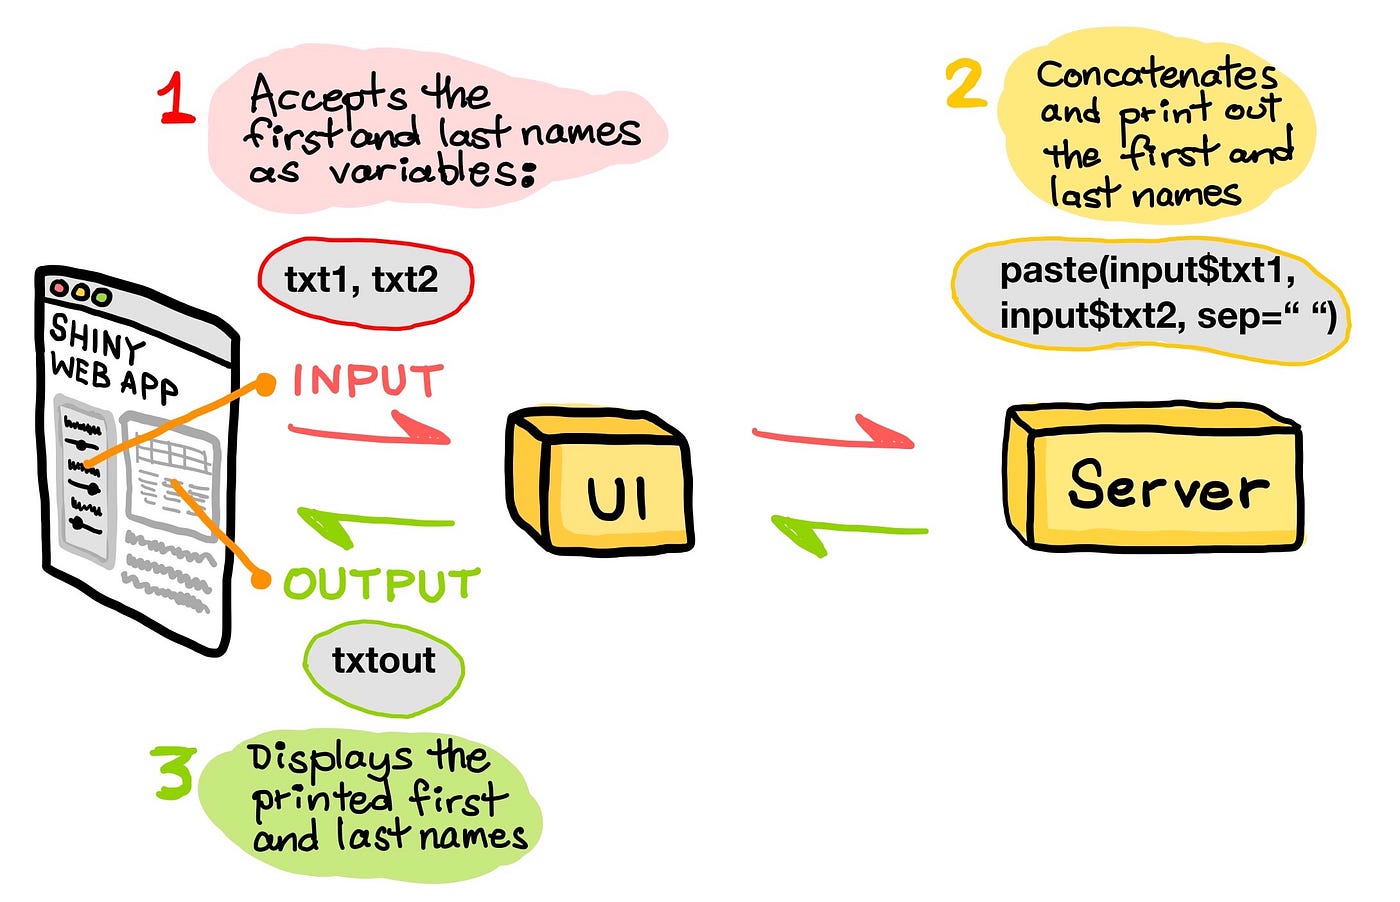
Line 34–36 — As shown in the above cartoon illustration, input values coming from
input$txt1andinput$txt2(i.e. corresponding to theGiven NameandSurname, respectively) as entered by the user are assigned to theoutput$txtoutvariable (i.e. the processed output value) that will be sent back to the UI for display in the Output text box (Line 21). Particularly, theGiven NameandSurnamewill be combined together via thepaste()function whereby the input arguments are thetxt1andtxt2variables from the text input of UI (i.e. theinput$txt1andinput$txt2on Line 35)
Make note thatoutput$txtouton Line 34–36 (from the Server function) is the same variable astxtouton Line 21 (from the UI function). Likewise, txt1 and txt2 on Lines 13 and 14 (from the UI function) are the same variables asinput$txt1andinput$txt2(from the Server function).
Create Shiny object (Lines 39–40)
Line 40 — The
shinyApp()function takes as input argument the ui and server variables defined above and fuses them together to build the actual Shiny web app that we finally see.
Congratulations! You have now successfully created your very first Shiny Web App in R!
Cover image drawn by the Author.