- Data Professor
- Posts
- How to Build an EDA App in Python
How to Build an EDA App in Python
Step-by-step tutorial from scratch in 50 lines of code
Chanin Nantasenamat
May 29, 2021

Exploratory data analysis (EDA) is an essential and preliminary first steps for exploring and summarizing the main characteristics of datasets. EDA provides the means to help us better understand variables and their relationships. This is achieved by non-graphical (descriptive statistics) and graphical (data visualization) techniques.
In this article, we will be creating an EDA web app that you can use to speed up your EDA analysis or allow your colleagues to perform EDA without having to code in Python. A simple upload of the input CSV file is all it takes to perform EDA analysis.
You can also refer to my YouTube video How to build an Exploratory Data Analysis app using Pandas Profiling on my YouTube channel (Data Professor) as a supplement to this article.
1. The EDA tool (Pandas Profiling)
A simple and intuitive EDA tool is the pandas-profiling library in Python. It allows the generation of a profile report for a df dataframe via the df.profile_report() function.
The generated profile is an interactive HTML report that displays the following statistics for each variable (please see the documentation for more details):
Type inference: Identifies the data types of columns in a dataframe.
Essentials: Type, unique values and missing values.
Quantile statistics: Minimum, maximum, Q1, median, Q3, range and interquartile range.
Descriptive statistics: Mean, mode, standard deviation, sum, median absolute deviation, coefficient of variation, kurtosis and skewness.
Most frequent values
Histograms: Distribution of value ranges.
Correlations: Highlighting highly correlated variables, Spearman, Pearson and Kendall matrices.
Missing values: Matrix, count, heatmap and dendrogram of missing values.
Duplicate rows: Lists the most occurring duplicate rows.
Text analysis: Learn about categories (Uppercase, Space), scripts (Latin, Cyrillic) and blocks (ASCII) of text data.
2. About the EDA App that we are building today
The EDA app that we are going to be building today will allows us to upload our own CSV dataset to the app, which will then automatically generate a profile report (an interactive HTML report that facilitates EDA analysis).
You can try it out for yourself here: EDA App demo
3. Code of the EDA App
The code spans a little over 50 lines of code, 52 to be exact.
Let’s take a look at the tech behind the app. It is based on 5 Python libraries consisting of the following:
numpy— used for generating a synthetic dataset consisting of 5 columns (variables) that is used an example dataset (notice thePress to use Example Datasetbutton in the main panel under the web app’s page title).pandas— used for housing the data in the form of a DataFrame.streamlit— the web framework that makes it possible to build a simple web app.pandas_profiling— the library that makes it possible to generate the interactive HTML report for performing EDA.streamlit_pandas_profiling— the library that allows thepandas_profilinglibrary to be used in a Streamlit web app.
import numpy as np
import pandas as pd
import streamlit as st
from pandas_profiling import ProfileReport
from streamlit_pandas_profiling import st_profile_report

# Web App Title
st.markdown('''
# **The EDA App**
This is the **EDA App** created in Streamlit using the **pandas-profiling** library.
**Credit:** App built in `Python` + `Streamlit` by [Chanin Nantasenamat](https://medium.com/@chanin.nantasenamat) (aka [Data Professor](http://youtube.com/dataprofessor))
---
''')

# Upload CSV data
with st.sidebar.header('1. Upload your CSV data'):
    uploaded_file = st.sidebar.file_uploader("Upload your input CSV file", type=["csv"])
    st.sidebar.markdown("""
[Example CSV input file](https://raw.githubusercontent.com/dataprofessor/data/master/delaney_solubility_with_descriptors.csv)
""")

# Pandas Profiling Report
if uploaded_file is not None:
    @st.cache
    def load_csv():
        csv = pd.read_csv(uploaded_file)
        return csv
    df = load_csv()
    pr = ProfileReport(df, explorative=True)
    st.header('**Input DataFrame**')
    st.write(df)
    st.write('---')
    st.header('**Pandas Profiling Report**')
    st_profile_report(pr)
else:
    st.info('Awaiting for CSV file to be uploaded.')
    if st.button('Press to use Example Dataset'):
        # Example data
        @st.cache
        def load_data():
            a = pd.DataFrame(
                np.random.rand(100, 5),
                columns=['a', 'b', 'c', 'd', 'e']
            )
            return a
        df = load_data()
        pr = ProfileReport(df, explorative=True)
        st.header('**Input DataFrame**')
        st.write(df)
        st.write('---')
        st.header('**Pandas Profiling Report**')
        st_profile_report(pr)
4. Line-by-Line Explanation of the Code
Lines 1–5
Import prerequisite libraries consisting of
numpy,pandas,streamlit,pandas_profilingandstreamlit_pandas_profiling
Lines 7–13
Line 7 — commented text to denote that the subsequent code block pertains to the web app’s title.
Lines 8–13 — the
st.markdown()function to print the web app’s title. The input arguments are in Markdown syntax .
Lines 15–20
Line 15 — Commented text to describe that Lines 16–20 is responsible for the CSV upload functionality.
Line 16 —
withis used to structure the subsequent lines of code to belong to the code block.st.sidebar.header()specifies the use of theheader()function to display the heading text1. Upload your CSV datain the left panel.Line 17 — The
st.sidebar.file_uploader()function allows the creation of the upload box. It should be noted thatst.sidebarspecifies the location of the upload box to be in the sidebar (the collapsible left panel). The input argumenttype=["csv"]found inside thefile_uploader()function specifies that the upload box would only accept thecsvfile type.Line 18 — The
st.sidebar.markdown()function specifies the use of themarkdown()function to display a link to the example CSV file to be in the left panel.
Lines 22–52
Line 22 — Commented text to describe that the subsequent code blocks are responsible for creating the Pandas Profiling report. It should be noted here that this section consists of an
if-elsestatement whereby theelsecode block (Lines 35–52) will be run at default every time the web app loads. Upon uploading an input CSV file, theifcode block (Lines 23–34) will then be activated and run.Lines 23–34 — This code block represents the
ifstatement. As mentioned above in the previous bullet point, this code block will run upon uploading of the input CSV file.
— Line 23 — Anifcondition is set to detect that a file is uploaded as indicated by theuploaded_file is not None.
— Line 24 — The@st.cachedecorator allows the app to skip a costly and repetitive of a function defined in the subsequent lines of code.
— Lines 25–27 — A custom function calledload_csvthat reads in the input CSV file from the upload box via theuploaded_filevariable.
— Line 28 — Contents of the CSV file as read from theload_csvcustom function is assigned to thedfvariable.
— Line 29 — TheProfileReport()function is assigned to theprvariable.
— Lines 30–31 — A header for**Input DataFrame**is printed as a heading text via thest.header()function (Line 30). Contents of the DataFrame stored in thedfvariable is printed (Line 31).
— Line 32 —"- — -”prints a horizontal bar.
— Line 33–34 — A header for**Pandas Profiling Report**is printed as a heading text via thest.header()function (Line 33). Contents of theprvariable, which stores the output from theProfileReport()function is printed. Particularly, this is the interactive HTML profile report that allows EDA functionality.Lines 35–52 — This code block represents the
elsestatement.
— Line 35 — Anelsecondition is set as the default state that is run every time the web app loads.
— Line 36 — A text sayingAwaiting for CSV file to be uploaded.is printed in an info box via thest.info()function.
— Lines 37–52 — Anifcondition is used to specify the consequences (statements underneath it will be run) of clicking thePress to use Example Datasetbutton, which is to use the example dataset to generate the profile report.
— Line 38 — Commented text to indicate that the following lines of code pertains to the example data.
— Line 39 — As described earlier for Line 24, the@st.cachedecorator allows the app to skip a potentially costly run of the subsequent lines of code (i.e. otherwise the app will re-generate the synthetic dataset everytime the app is reloaded).
— Lines 40–45 — A custom function is defined to create a synthetic dataset consisting of 5 columns using theNumPylibrary.
— Line 46 — The synthetic dataset as defined by the custom function from Lines 40–45 is assigned to thedfvariable.
5. Running the EDA App
It’s now time to run the app.
5.1. Create the conda environment
Let’s assume that you are starting from scratch, thus you will have to create a new conda environment (which is a good idea in order to ensure reproducibility of your code).
Firstly, create a new conda environment called eda as follows in a terminal command line:
conda create -n eda python=3.7.9 Secondly, we will login to the eda environment
conda activate eda5.2. Install prerequisite libraries
Firstly, download the requirements.txt file
wget https://raw.githubusercontent.com/dataprofessor/eda-app/main/requirements.txtSecondly, install the libraries as shown below
pip install -r requirements.txt5.3. Download the EDA App files
You can either download the web app files that are hosted on the GitHub repo of the Data Professor or you also use the 52 lines of code found above.
wget https://github.com/dataprofessor/eda-app/archive/main.zipNext, unzip the file contents
unzip main.zip Now enter the main directory via the cd command
cd main Now that you’re inside the main directory you should be able to see the app.py file.
5.4. Launching the web app
The app can be launched by typing the following commands into a terminal prompt (i.e. ensure that the app.py file is in the current working directory):
streamlit run app.pyAfterwards, you will see the following message in the terminal prompt.
> streamlit run app.pyYou can now view your Streamlit app in your browser.Local URL: http://localhost:8501
Network URL: http://10.0.0.11:8501
Finally, a browser should pop up and the app appears.
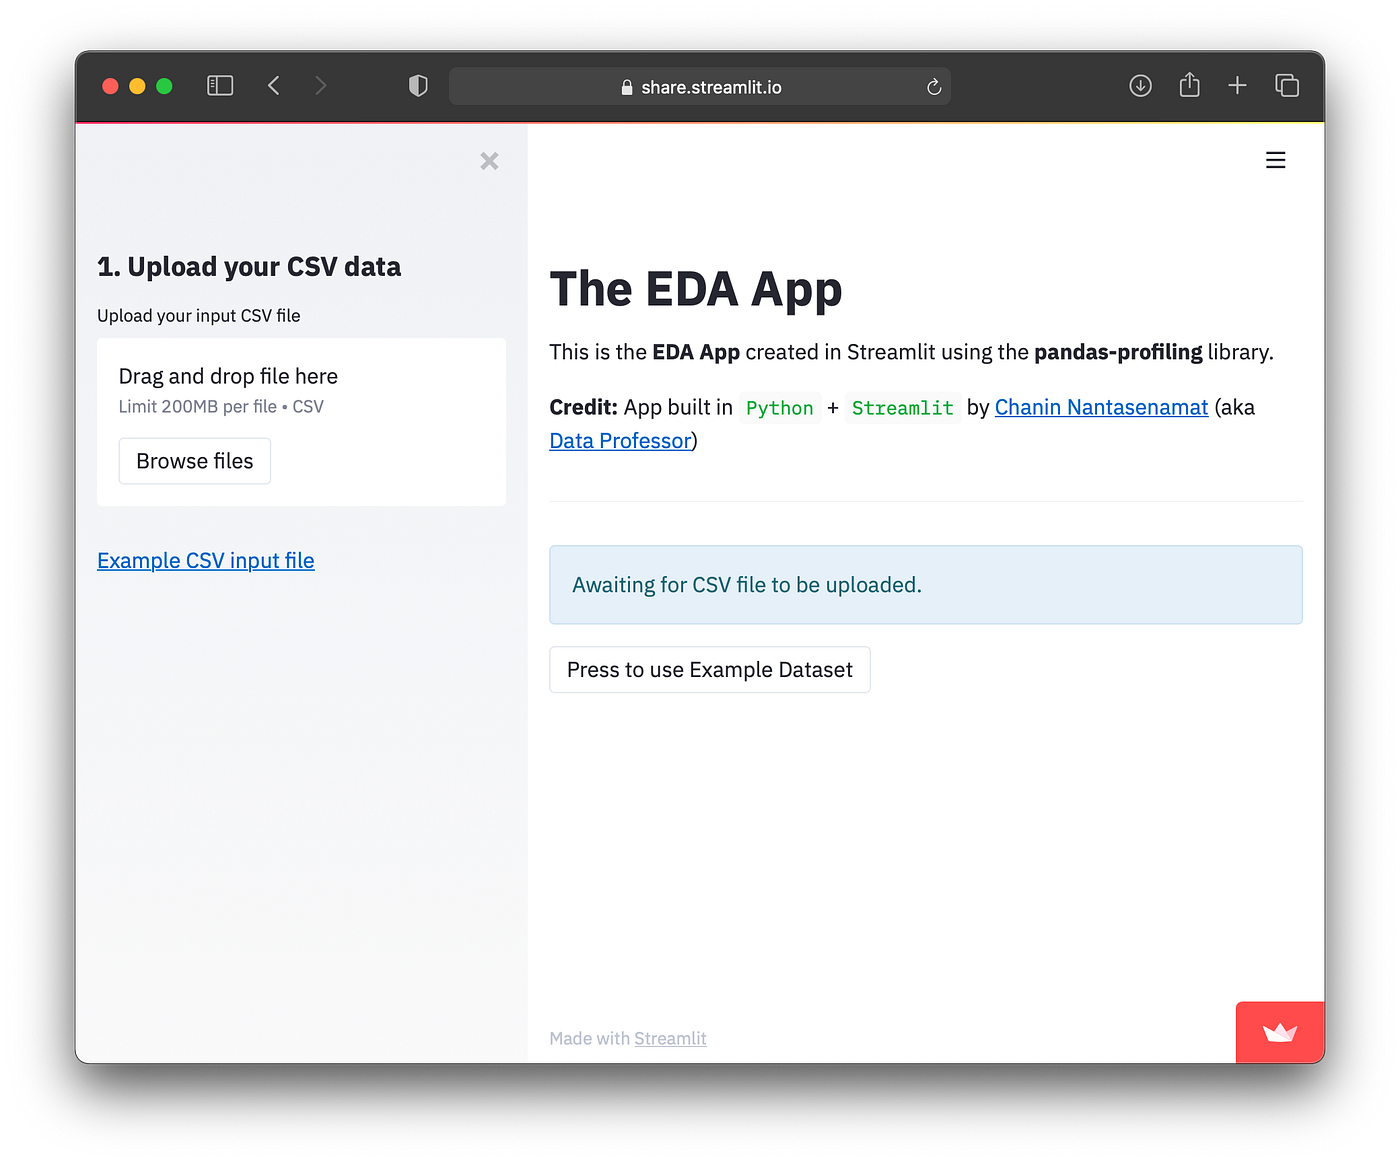
Screenshot of the EDA App. To try out the app please refer to the EDA App demo.
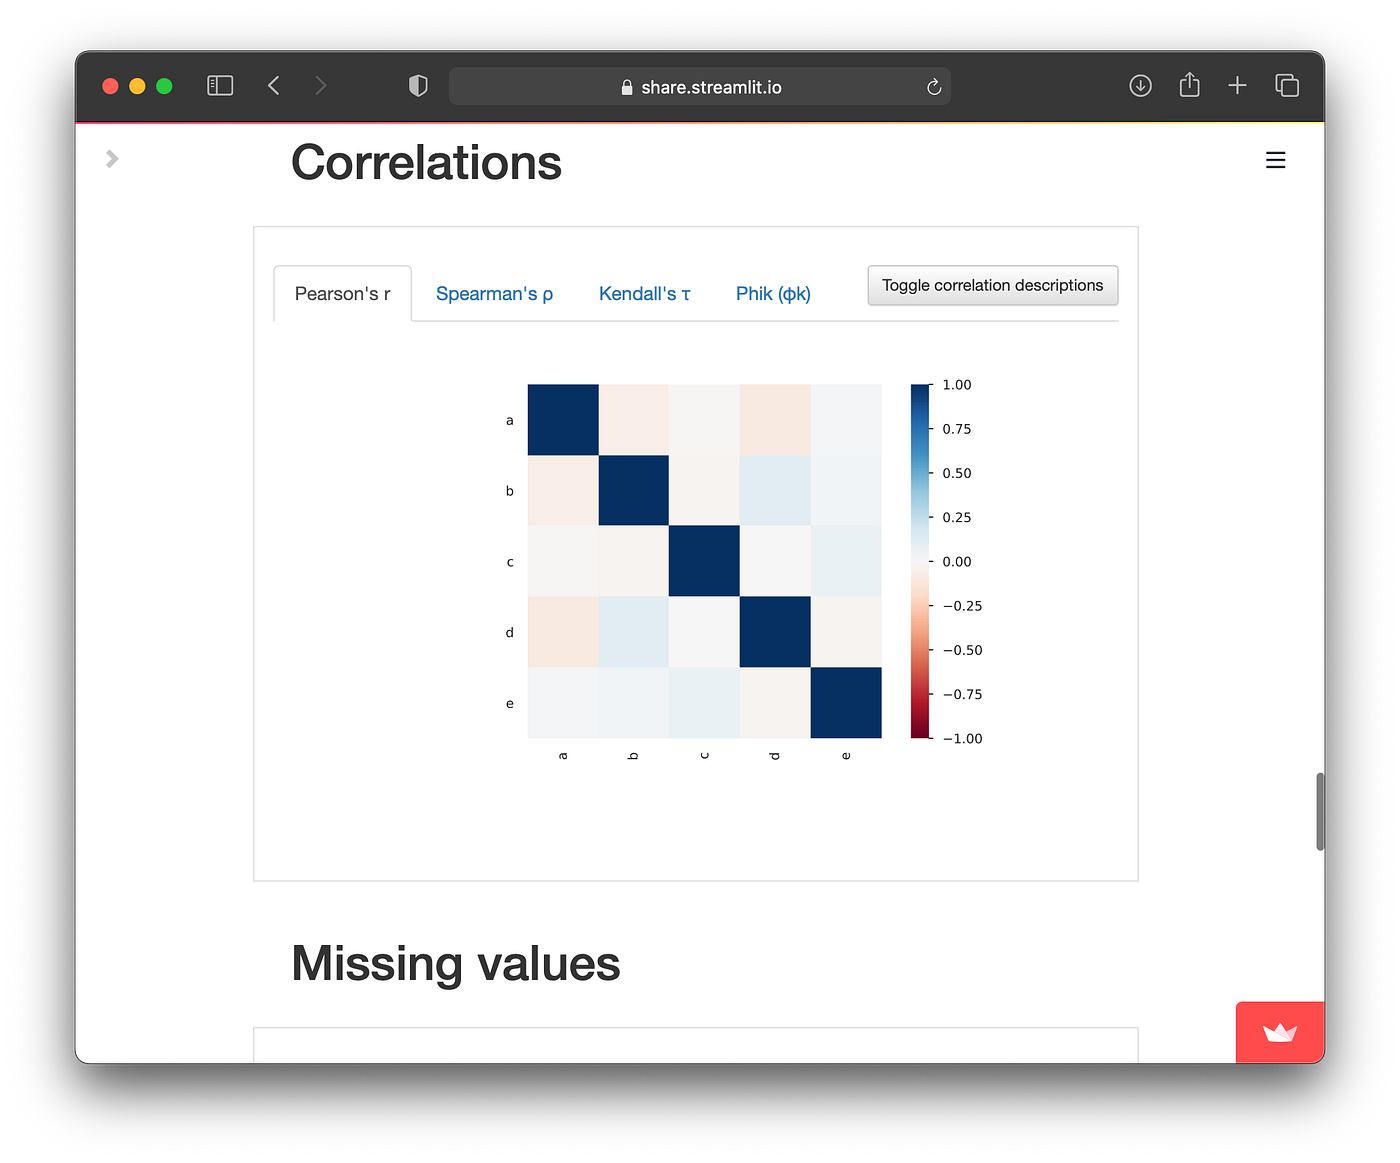
Screenshot of the EDA App in action. We can see here the correlations plots. Please refer to the image above in section 2 for an animated example.
Congratulations!
You have now created an EDA app that will allow you to easily perform EDA analysis on-the-go, just simply upload an input CSV file to get started in performing EDA analysis.
Deploying the EDA App to the Internet
If you would like to make your web app publicly available to the world, you can deploy it to the internet. I’ve created YouTube videos showing how you can do that on Heroku and Streamlit Sharing.
An example of the deployed EDA App on the internet via the Streamlit Sharing platform can be accessible here: EDA App demo